Infographics
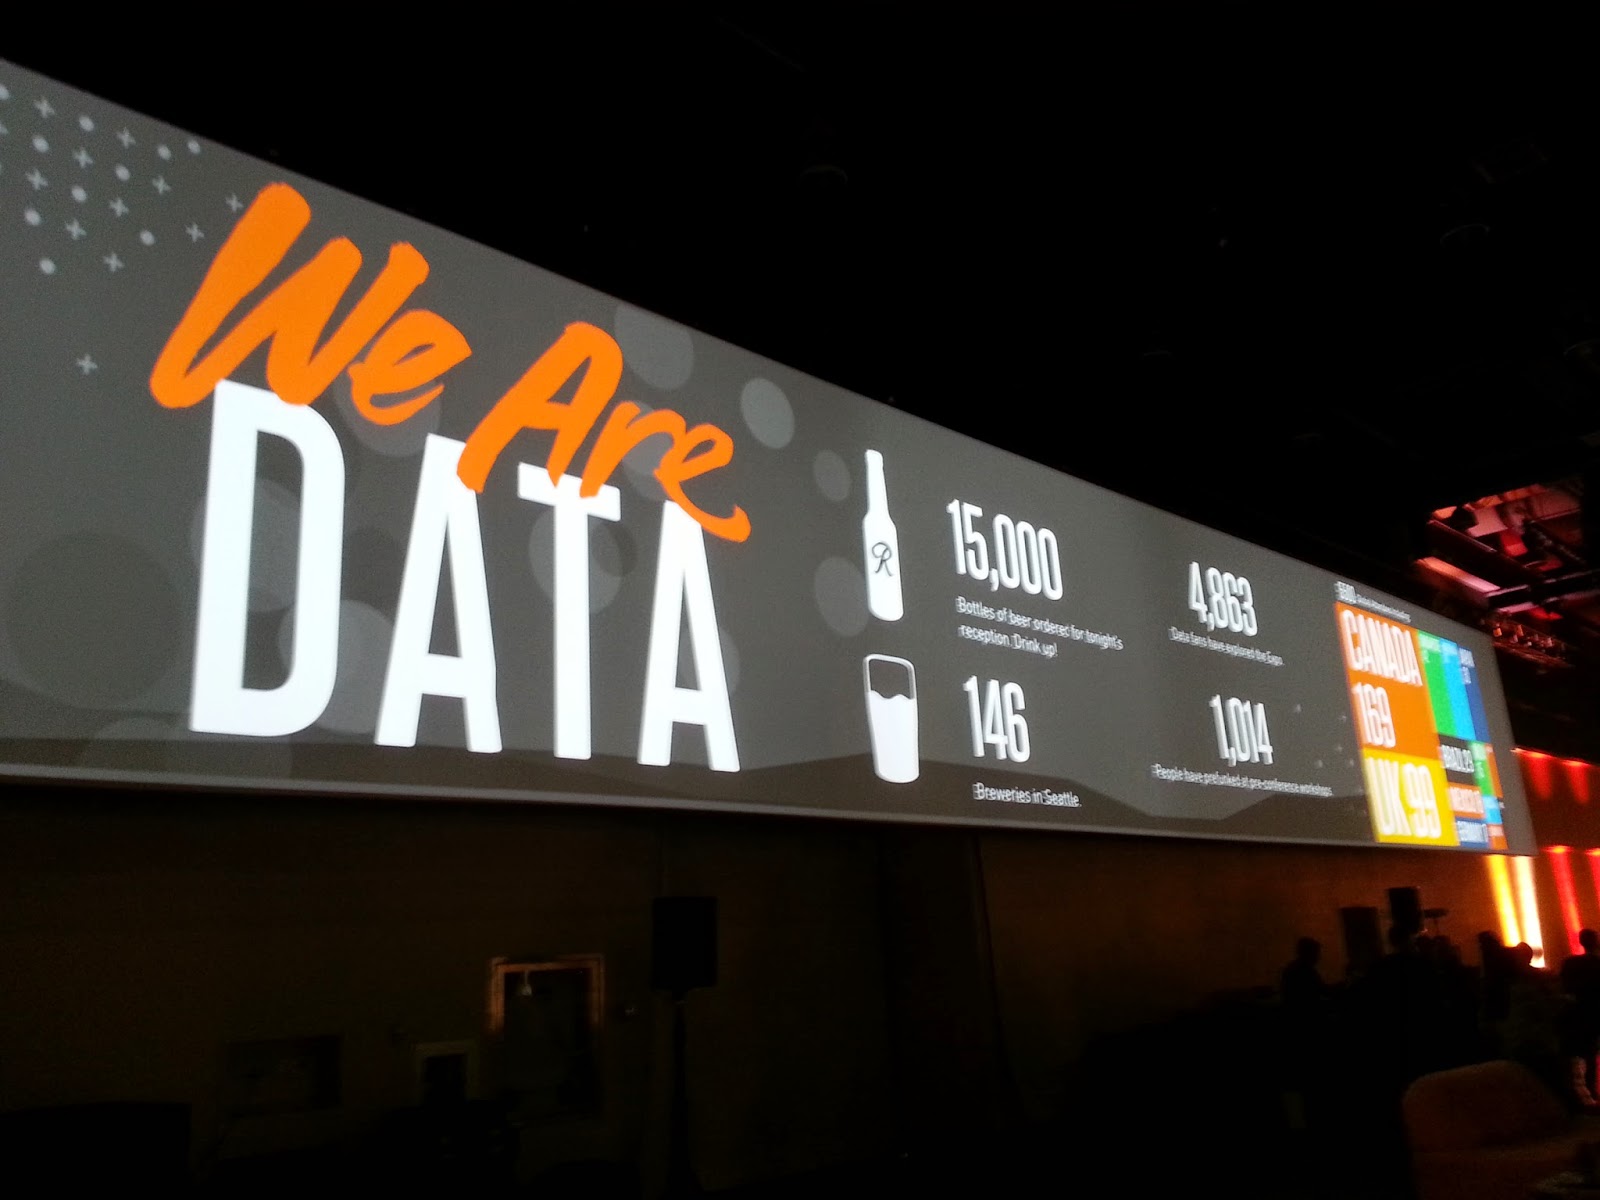
It's quite amazing to see the explosion of data + design. Everywhere you look, data is now being communicated in a visual way. The most common occurrence of this intersection of data + design occurs with infographics.
One infographic that is able to communicate a wealth of information in a visual way is the 2014 US Federal Budget from Visual.ly:
One infographic that is able to communicate a wealth of information in a visual way is the 2014 US Federal Budget from Visual.ly:


Comments
Post a Comment