Destination Data
Having just returned from the 2014 Tableau Conference, I was debating whether or not I should blog about it. I realized I've received so much from the Tableau Community over the years that it would be a shame to not share my thoughts. So, here we go ...

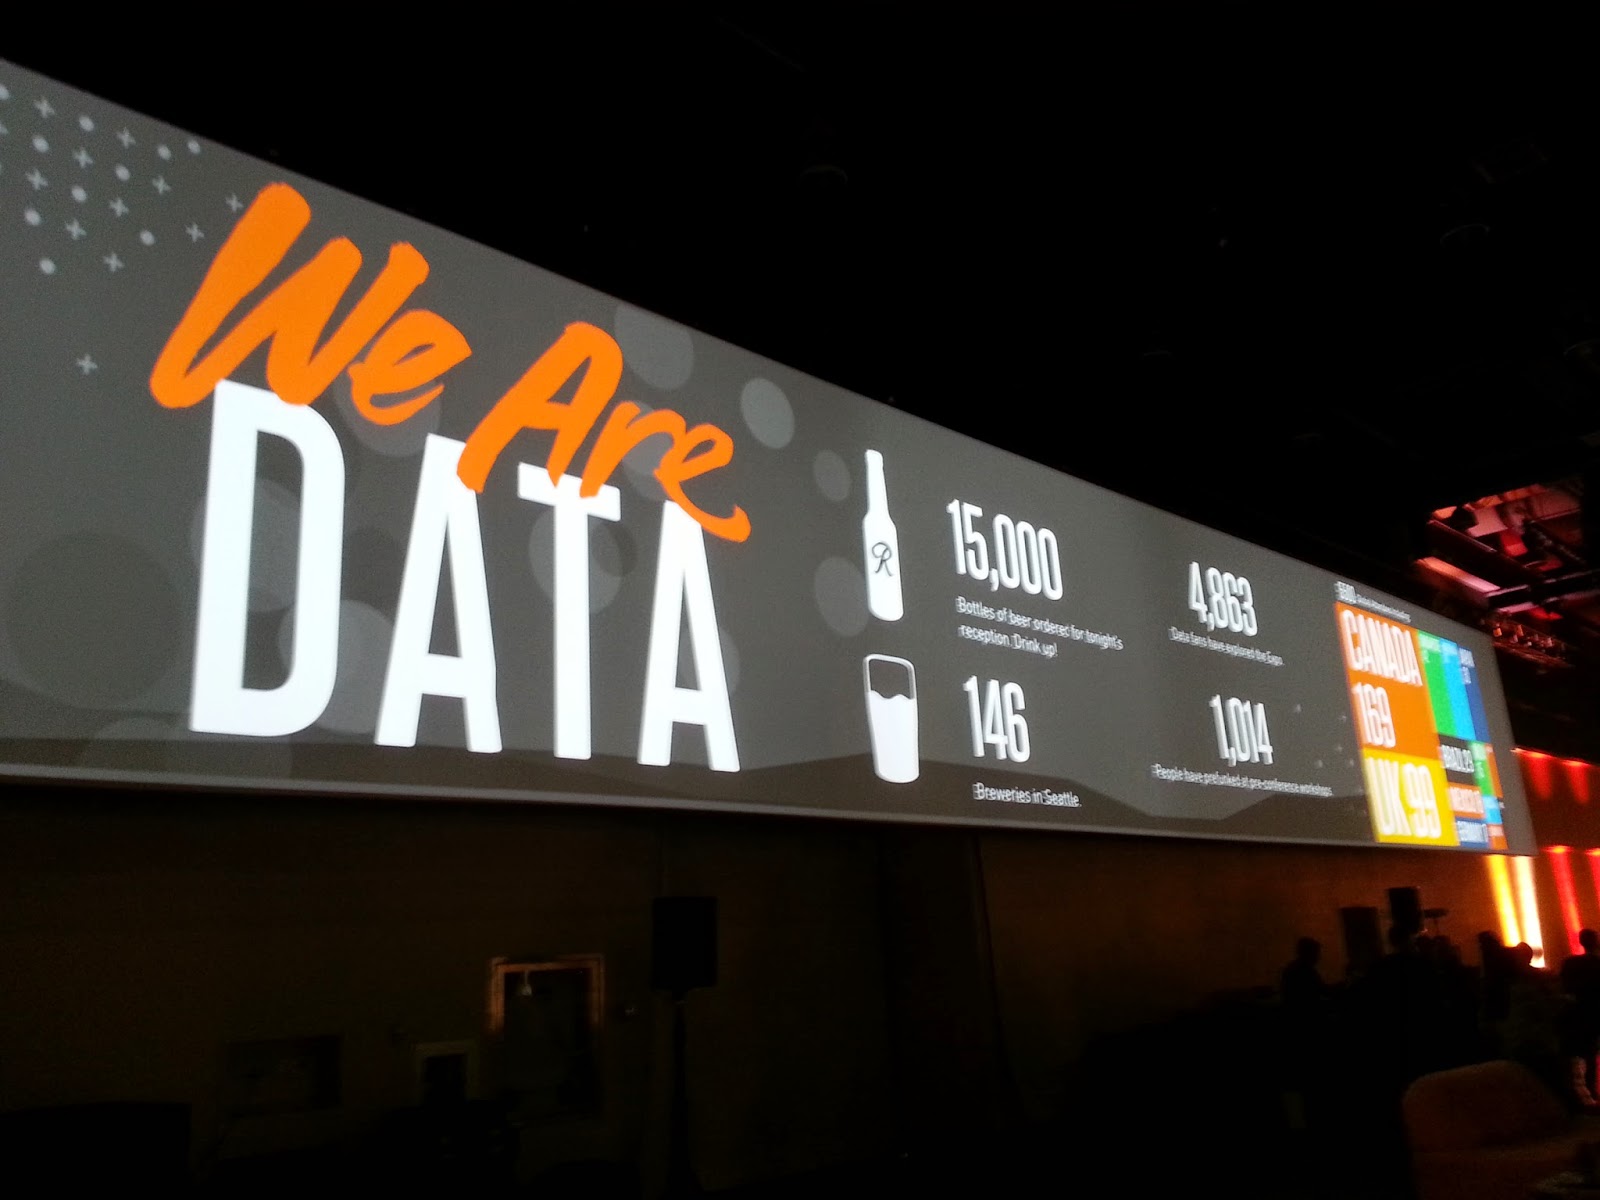
TABLEAU CONFERENCE IS BIG!
One thought that definitely stuck out was the sheer size of this year's conference! There were 5,500 attendees so it was definitely crowded at times. But it was a reminder of the incredible growth that Tableau has been experiencing and how, so many others have found Tableau to be a tool that not only gets the job done, yet also delights. I like how one person said that Tableau is the closest thing he's found to playing a video game at work. I totally agree!
If you're going to attend one data/analytics conference during the year, this is the ONE you want to go to. I was anticipating the first keynote because it always sets the stage for what is to come. Having heard Christian (Tableau's CEO) at previous Tableau conferences, I was curious as to what he would say. I liked how he brought it back to the mission of Tableau - to help people to see and to understand data.

I really enjoyed Christian's keynote on the "Art of Analytics". The main point that stuck out for me is that Tableau truly excels at combining Art & Analytics because you have the ability to quickly discover and analyze your data, but you get to unleash your creativity as well. It's about keeping you in the "flow" of analyzing and creating visual stories. And that's where many of the future improvements that are coming in Tableau version 9 are rooted from ... continuing that flow so everything is seamless from the data preparation to answering questions.
An interesting note is that Tableau didn't officially announce when these new improvements are coming in version 9. However, it sounds like it will be sometime in the first half of 2015. I was still waiting to hear about "Dynamic Parameters", but unfortunately, it doesn't sound like that is coming in version 9.
The announcement that really impressed the attendees, including myself, was regarding Mobile - Tableau is working on a new app that is called, "Project Elastic" which allows you to explore data directly from your tablet.
It looks to take the simplicity and joy of using Tableau Desktop and mirror that same experience on a tablet. Will definitely be interesting to see how that progresses and when we all will get a chance to play with the app.
For many of us who have come to discover Tableau, I believe the reason it has made such an impact is that it is one of the few tools ... maybe the only tool that effectively combines both Data + Design. I always tell my friends and my co-workers that Tableau is like that secret weapon that just makes you look good. And it was apparent that at this year's conference ... the secret is out ... if you analyze data or do anything related to data, you need to use Tableau.
PARTY WITH YOUR DATA!
Another realization is that Tableau knows how to throw a party! It was unreal how they rented out the entire Seattle Center. I was roaming around the whole area ... from the Space Needle to Chihuly Garden and Glass. It was amazing that everything was free for us to check out - you could tell that everyone was having a fantastic time!


My favorite part of the party was when I was grabbing tacos from one of the food trucks and I ran into Jonathan Drummey. Not only is he a Tableau Zen Master, but he also writes a wonderful Tableau blog. I've read it many times and it has been especially helpful when I've needed to find a solution to a vexing issue I'm having with Tableau. We had a great conversation and something that struck me about Jonathan and the entire Tableau Community is that people are so willing to help one another. Jonathan encouraged me to blog and to share with the community. I have to admit the Tableau Community is strong and it's a BIG reason why Tableau continues to be so popular.
SKETCHING is KEY to CREATING!


One thing that caught my eye in the Space Needle was the wall that shared how it all started with a sketch. I've been challenged lately to sketch out my visualizations and to use analog tools (pen + paper) before jumping into digital tools. It's neat to see that what we think is new is often something that those before us have found to be effective. And there's just something that unlocks when we use pen + paper to sketch out our thoughts and our ideas.
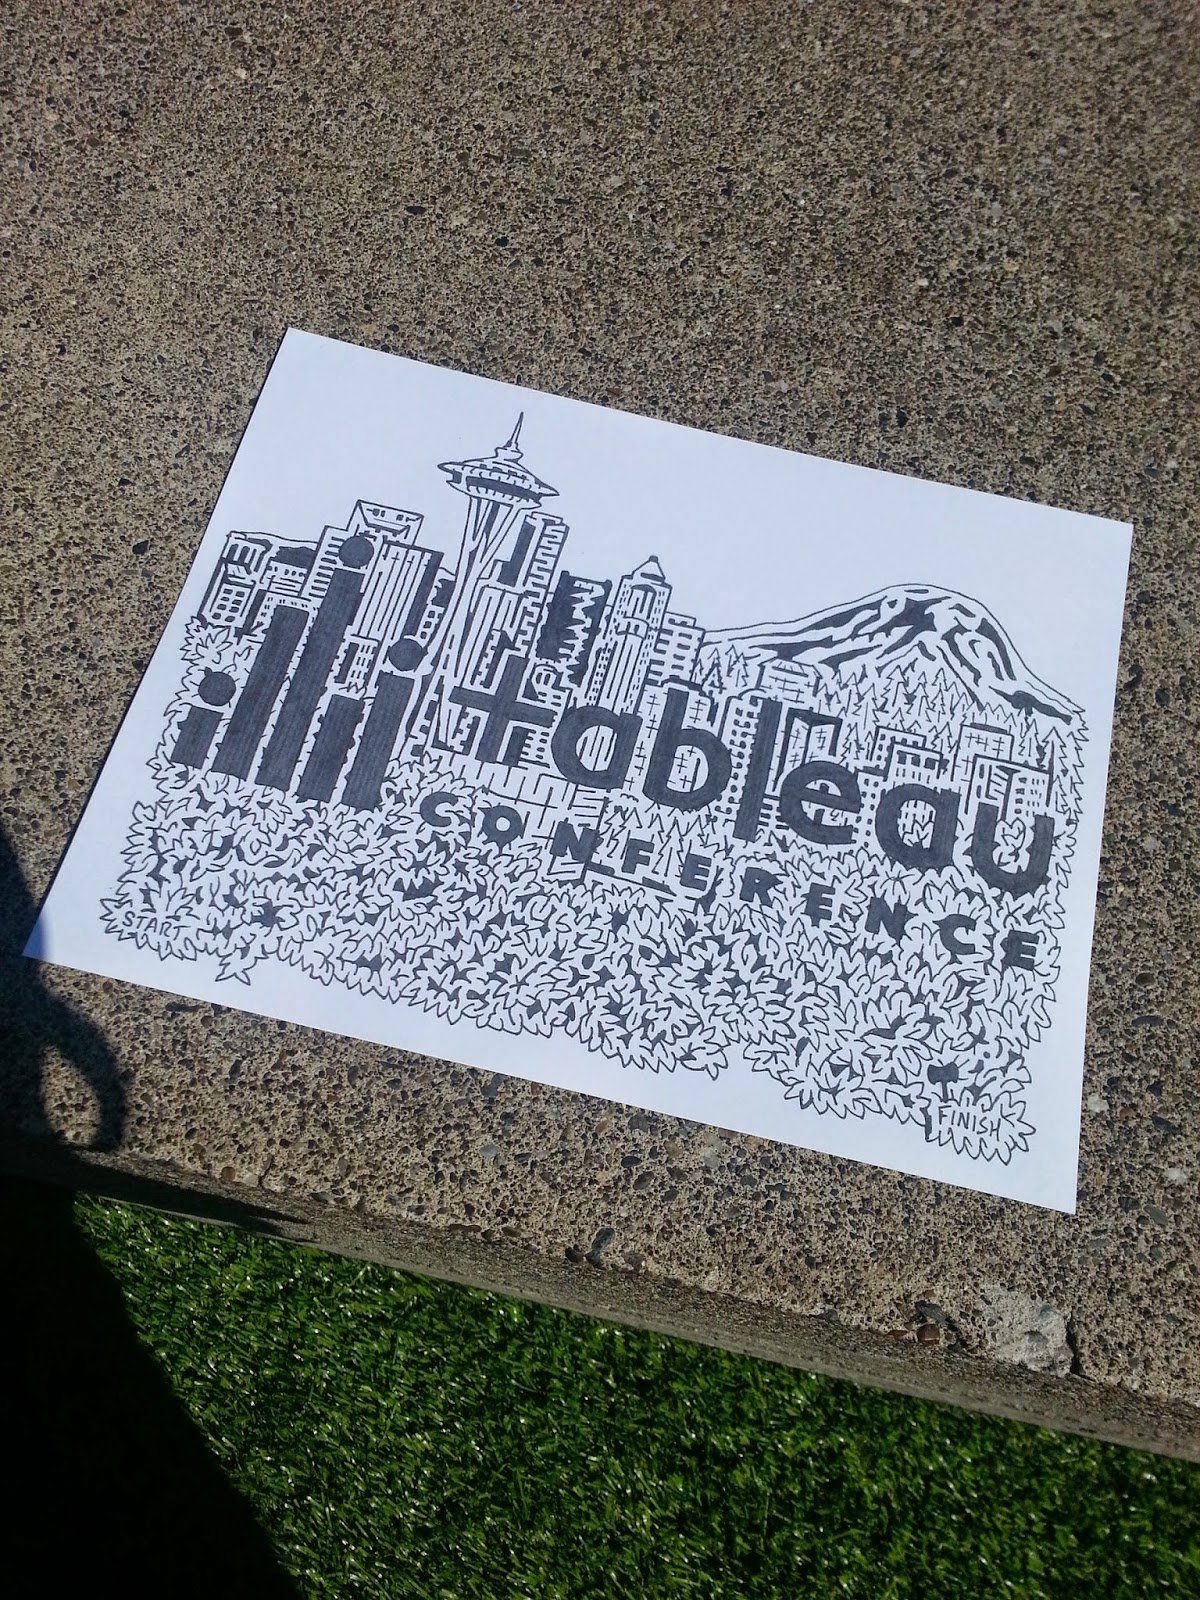
I loved the #data14 wall which allowed attendees to express themselves creatively. Folks drew pictures and used words to share all the different places they came from. Over in the data playground (an outdoor area for attendees to hang out during lunch), there were these really cool Tableau drawings/sketches which also doubled as a maze - you'll notice they have a start and a finish.


I think it was around that time that it finally hit me ... there's ONE main reason that I always enjoy attending Tableau Conferences and that's because ... you always leave INSPIRED. It's so thrilling to see what others are doing ... you start to see what is possible and you realize you are only limited by your imagination and some crazy table calc/hack that you never knew existed. :)
The speaker lineup this year was fantastic! Just having one of these guys would have been incredible, but to have all of them at one conference showed that Tableau really went out of its way to make this year's conference even BIGGER and BETTER!!
Each of the speakers reminded me that you gain so much knowledge and value when you hear from those who are in the data industry and from those who are not. There were so many of those "aha" moments during the keynote sessions that I had to constantly jot down notes - all of these were taken from tweets:
- "Have the language match the data." - Neil deGrasse Tyson #nosupermoon #data14
- "Innovation often takes moxie." Key takeaway from today's #data14 keynote with Author, Michael Lewis. #courage #challengestatusquo
- In telling stories, you have to give your audience the luxury of ignorance. Simplify the complexity for them - Michael Lewis at #data14
- "If you don't sleep well, you don't think well." -John Medina #data14
- John Medina: you don’t sleep to rest; you sleep to learn. #data14
- "Governments have no control over what happens in the bedroom" Hans Rosling at #Tableau #data14
- "In the last 20 years the proportion of people living in extreme poverty has almost halved." - Hans Rosling #data14

There were so many wonderful sessions I attended. A few of my favorites were the Zen Masters Tips & Tricks Panel, Data-Driven Innovation & The New Interaction Paradigms of the Post-Screen Era by Cliff Kuang of Wired and 21st-Century Presentation (Visual Storytelling) by Garr Reynolds.
Garr Reynolds gave a wonderful presentation on storytelling that was informative, fun and entertaining! Would be awesome to have him as a Keynote speaker at next year's conference!

It was at one of the meetups that I heard Bruce Boston sum up what he does for living and it was so simple, but so true. For those of us who work with data ... pretty much what we do is ... add (+), subtract (-), multiply (x) and divide (/).
Or as Bruce would say, what he does in his work is simply: SIMPLE MATH + STORYTELLING. We are all trying to share insights and the most effective way to do this is through stories.
And I suppose that's where I'll end this blog entry. Keep on telling stories with your data. And keep on creating ... whether that be creative problem-solving, a creative data viz, or by unleashing your creative potential.


Hopefully I'll see you in Vegas for next year's Tableau Conference! Can't wait for #data15!

This comment has been removed by the author.
ReplyDelete